Indicators for quality improvement -step 2
- Introduction...
- 1. Measurement...
- 2. What is an indi...
- 3. Process and out...
- 4. Process and out...
- 5. Why do we need ...
- 6. Qualities of a ...
- 7. Key elements fo...
- 8. Developing indi...
- 9. Developing indi...
- 10. Example of goo...
- 11. Plotting a tim...
- 12. Time-series ch...
- 13. Chart...
- 14. Time-series ch...
- 15. Key Tips...
 |
 |
Introduction
DR. ANU SACHDEVA
MD, DNB, DM (Neonatology)
Assistant Professor,
Department of Pediatrics
AIIMS, New Delhi
1. Measurement
► Determine the indicators which enable us to know
whether we have made improvement
► Look at baseline data and information
2. What is an indicator?
► A measurement tool
♦ Defines a rate/ratio or an event
► Used as guide to monitor and evaluate the quality
of healthcare – Is it improving?
► A tool to make continuous improvement in quality
of care
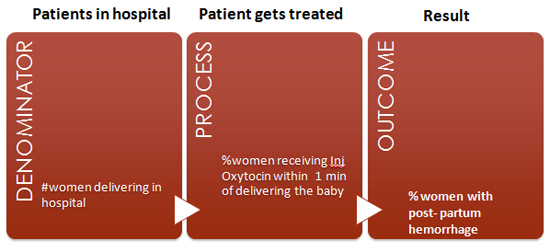
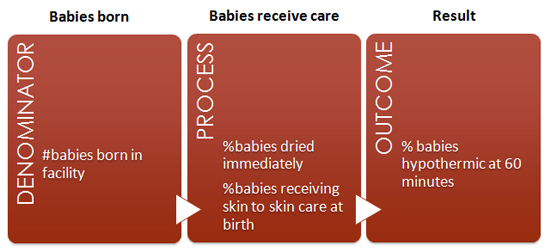
3. Process and outcome indicators?
► Measure of Process – actions that are taken in
delivery of care
♦ Washing hands to prevent infections
► Outcome (“in the population…”)
♦ Incidence of infection in the patients
4. Process and outcome indicators?
► If you don’t measure process, how will you know
♦ What led to improvement?
► If you don’t measure outcome, how will you know
♦ If improvement has occurred?
5. Why do we need indicators?
► To measure the specific processes and outcomes
► The quantitative data can be used by teams and
organizations for assessment and analysis of trend over
time
► They allow us to make comparisons with other health
care facilities
6. Qualities of a good indicator
► Clear and unambiguous (teams will not confuse what
is meant by a particular indicator)
► Identifies a clear numerator and denominator
► Also important to decide
♦ Source of data and who is collecting it
♦ Frequency at which data would be collected
7. Key elements for putting indicators to use
► Indicators should be linked to aims
► Should be used to test change and guide improvement
► Should be integrated into team’s daily routine
► Important to select a few key measures – don’t
overburden with endless data collection
8. Developing indicators
9. Developing indicators 1
10. Example of good indicator
Indicator: The rate of PPH in women in the hospital
► Numerator: Number of cases of PPH
► Denominator: Number of women giving birth
► Source: Labour room register in the health facility
► Person responsible: Delivery room nurse
► Frequency: Labour room register will be reviewed
monthly
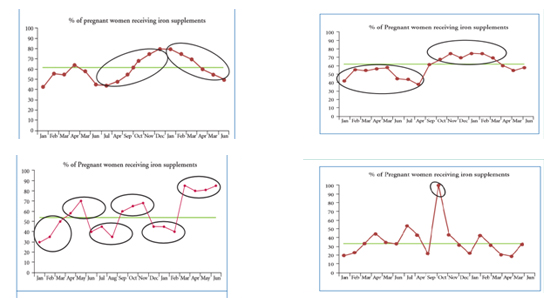
11. Plotting a time series chart
► Title: Clear and well defined title that includes
what and when
► X and Y axis have clear scale and include indicator label
♦ X axis: Time period - days/weeks/months
♦ Y axis: measurement in %, proportion
► Annotation of variables
► Numerator and denominator values are shown
12. Time-series chart
Percentage of women receiving uterotonic within one minute

13. Chart
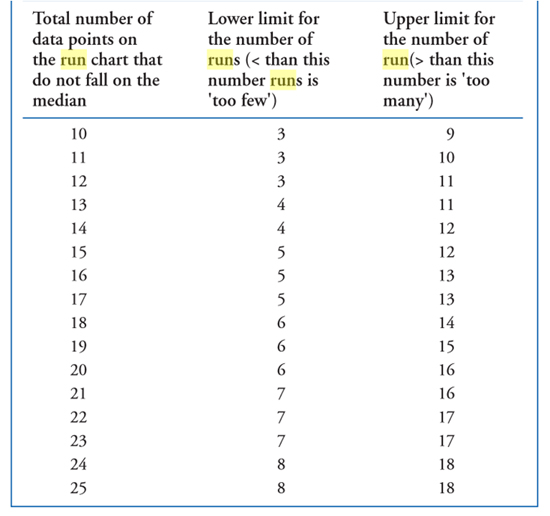
14. Time-series chart
► If the number of runs is out-of-range for the given number
of data points (refer to adjacent table), it suggests that
something of relevance has happened
15. Key Tips
► Looking at data overtime is crucial and more frequent
measurement (daily or weekly) is better than less frequent
(monthly)
► Only collect data what you are going to use
► If possible, try to use data that are already recorded in
your health facility or that will be easy to collect