Tools for quality improvment
- Introduction...
- 1. Steps in QI...
- 2. Step 2 Learning...
- 3. Quality Improve...
- 4. People not unde...
- 5. Seven Quality T...
- 6. Step 2: Analyzi...
- 7. Henry Ford...
- 8. Fishbone...
- 9. Establishing Sk...
- 10. Whys...
- 11. Tree Diagram-G...
- 12. Five whys...
- 13. Pareto charts...
- 14. Pareto Charts...
- 15. When to Use a ...
- 16. Medication Err...
- 17. Process flow c...
- 18. How to create ...
- 19. Flow chart...
- 20. Key tips...
 |
 |
Introduction
DR. K. APARNA SHARMA
Associate Professor
Department of Obstetrics and Gynaecology
All India Institute of Medical Sciences
New Delhi
1. Steps in QI
► Step 1: Identifying a problem, forming a team and
writing an aim statement
► Step 2: Analyzing the problem and measuring quality
of care
► Step 3: Developing and testing changes
► Step 4: Sustaining improvement

2. Step 2 Learning objectives
► Tools for understanding processes and systems of
healthcare and how to use them
► How these tools can help identify possible
solutions to reach your aim
► How to choose indicators for process and outcome
► How to use indicators to track progress
and improvement
3. Quality Improvement
“Business of Management” in Medicine
Every System is perfectly designed to achieve exactly the results it gets
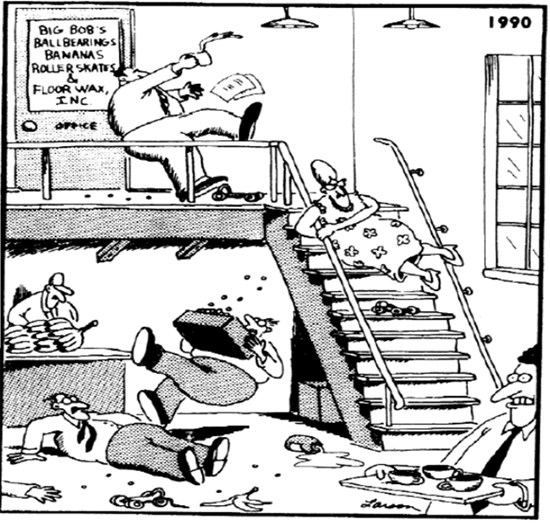
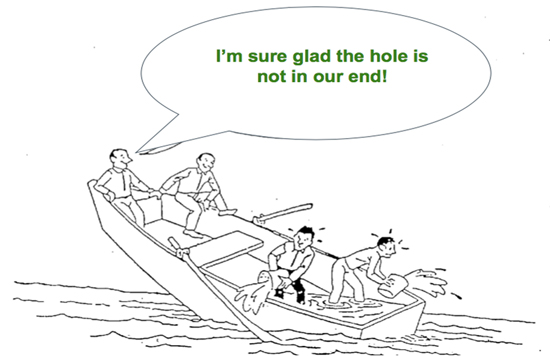
4. People not understanding the concept of a system
An example
5. Seven Quality Tools
► Cause and Effect Diagrams
► Flow Charts
► Checksheets
► Histograms
► Pareto Charts
► Control Charts
► Scatter Diagrams
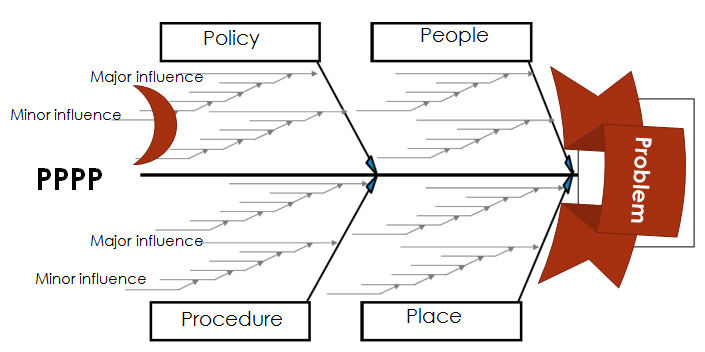
6. Step 2: Analyzing and measuring quality of care Cause & effect
► Why might a problem be happening?
► Get to the root cause of the quality issue (4P’s)
♦ People
♦ Places
♦ Procedures (practices)
♦ Policies
♦ anything else
7. Henry Ford
There are no big problems, there are just a lot of little problems.
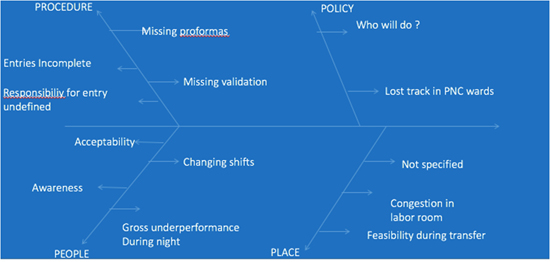
8. Fishbone
► Get to the root cause of the quality issue(4P’s)
9. Establishing Skin to Skin Contact after delivery
10. Whys
► Curiosity killed the cat?
► You could be a child again !

When the “Why s” give you the “What” (..needs to be done?)
11. Tree Diagram-Graphic display of the 5 whys

12. Five whys
► Mothers are not breastfeeding – Why?
► They feel uncomfortable taking their gown off – Why?
► The gown opens at back, so they have to take entire gown
off to breast feed, so they feel exposed. Why? they have
this type gown?
► That is what store keeper orders. Why? doesn’t the store
keeper order better gowns appropriate for breast feeding?
► Because no one has requested him to do that
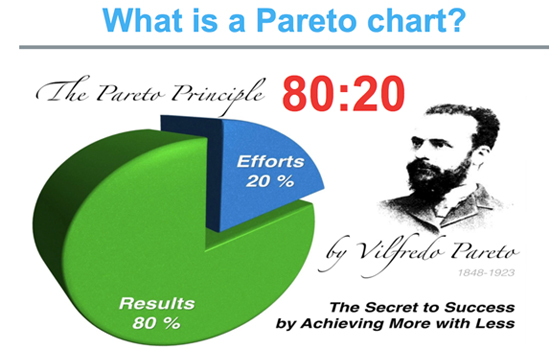
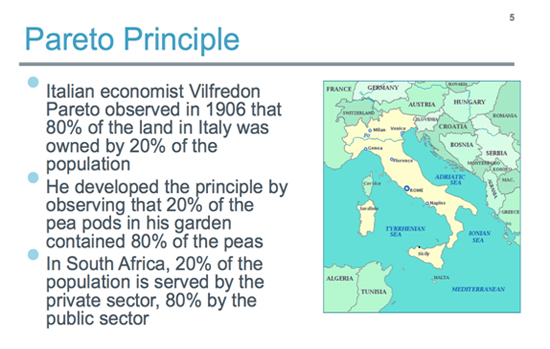
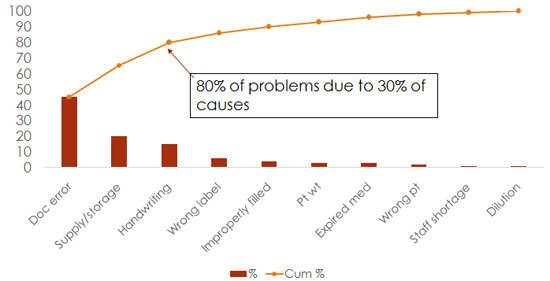
13. Pareto charts
80% of the problem is due to 20% of causes
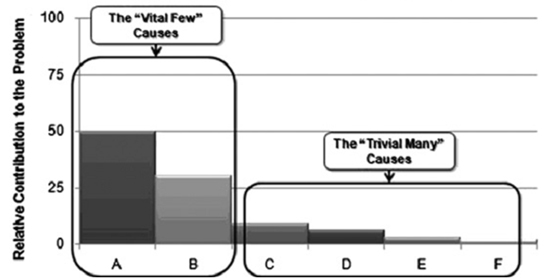
14. Pareto Charts
15. When to Use a Pareto Chart?
► When there are numerous causes to a problem
► When you want to analyze the frequency of the causes
behind a problem
► When you want to categorize the problems having
a potential to contribute to improving the problem you
are addressing
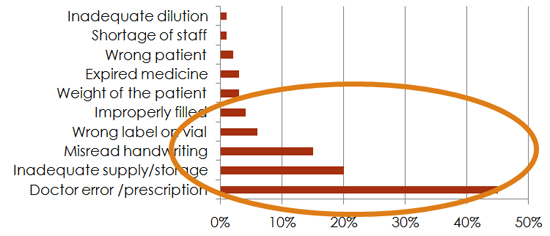
16. Medication Error
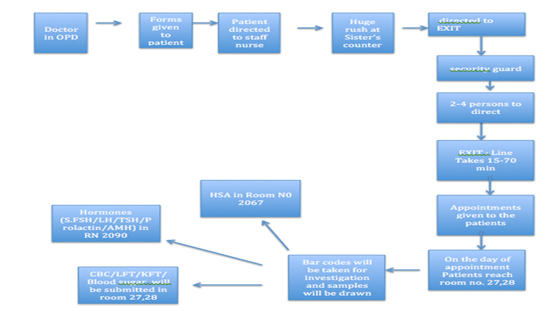
17. Process flow chart
► How to develop a process flow chart
► Decide the beginning and end points of the process
to be flow charted
► Identify the steps of the process as these are
practiced at present
► Link the steps with arrows showing direction
► Review the chart to see whether the steps are in
their logical order to achieve the end point efficiently:
Is the order wrong, are some steps unnecessary?
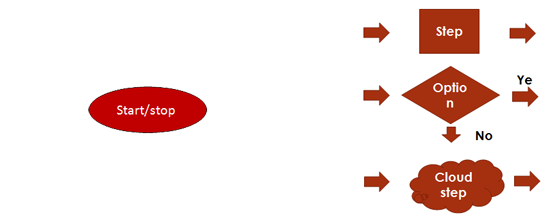
18. How to create a process Flow chart
► One flow line out of step
► Two flow lines out of steps that lead to different options
► One flow line out of cloud steps that are not clear
19. Flow chart
20. Key tips
► Analysis helps to find out the root cause of problems
Try to find few barriers that account for most of the problem
Help the teams think about how re-organization can help
with fixing the problem
Video on Pareto chart